07.1
From Dish Names to Ingredient Level Understanding
The Meituan article focuses on ingredient level understanding and introduces the CMIngre benchmark alongside a business application for dish knowledge graphs. Published on May 17, 2024, it relates to the paper Toward Chinese Food Understanding: A Cross-Modal Ingredient-Level Benchmark. Online publication and journal volume dates differ, so the bibliography records them separately rather than treating one project as two independent studies. The article explains business motivation and workflow, while the paper and dataset support examination of benchmark definitions and experimental settings.[R03][R04][R05]
A dish name is a highly compressed label. The same name can refer to different ingredients, cooking methods, and regional versions, while similar ingredients can become visually different dishes. A mapping from name to category alone therefore offers limited support for detailed product understanding. This report proposes reading the case with names as entry points and ingredients, preparation, taste, and restaurant versions as separately verifiable attributes. These relations should be supported by menu text, visual observations, or other records rather than inferred automatically from the name. The distinction determines whether a graph repeats general expectations or describes a specific product. The first lesson of the case is the value of moving the research question to a finer level.
07.2
Dataset Scale Sources and Label Hierarchy
CMIngre contains 8,001 image and ingredient pairs, 429 ingredient labels, and 95,290 bounding boxes. Its sources comprise 1,719 dish pairs, 2,330 recipe pairs, and 3,952 user generated pairs. Ingredient detection experiments map fine labels to 67 coarser categories. These counts describe different levels and are not interchangeable. Cleaning includes treatment of infrequent labels and semantic merging, so the final label space reflects both domain concepts and available evidence.[R03][R05]
The analytical issue is the evaluation boundary behind these numbers. Sources can differ in clarity, camera angle, and textual completeness. A random mixed split may make transfer appear easier because training and testing share source styles. Coarsening labels reduces recognition difficulty while potentially hiding fine category errors. Educational and operational use should therefore report label level, per category distributions, and source splits together. Reproduction requires fixed dataset versions and split manifests, including checks for near duplicate images. Total sample size alone does not characterize difficulty, especially when many bounding boxes belong to a few common ingredients. Aggregate scores can conceal weaknesses on rare categories.
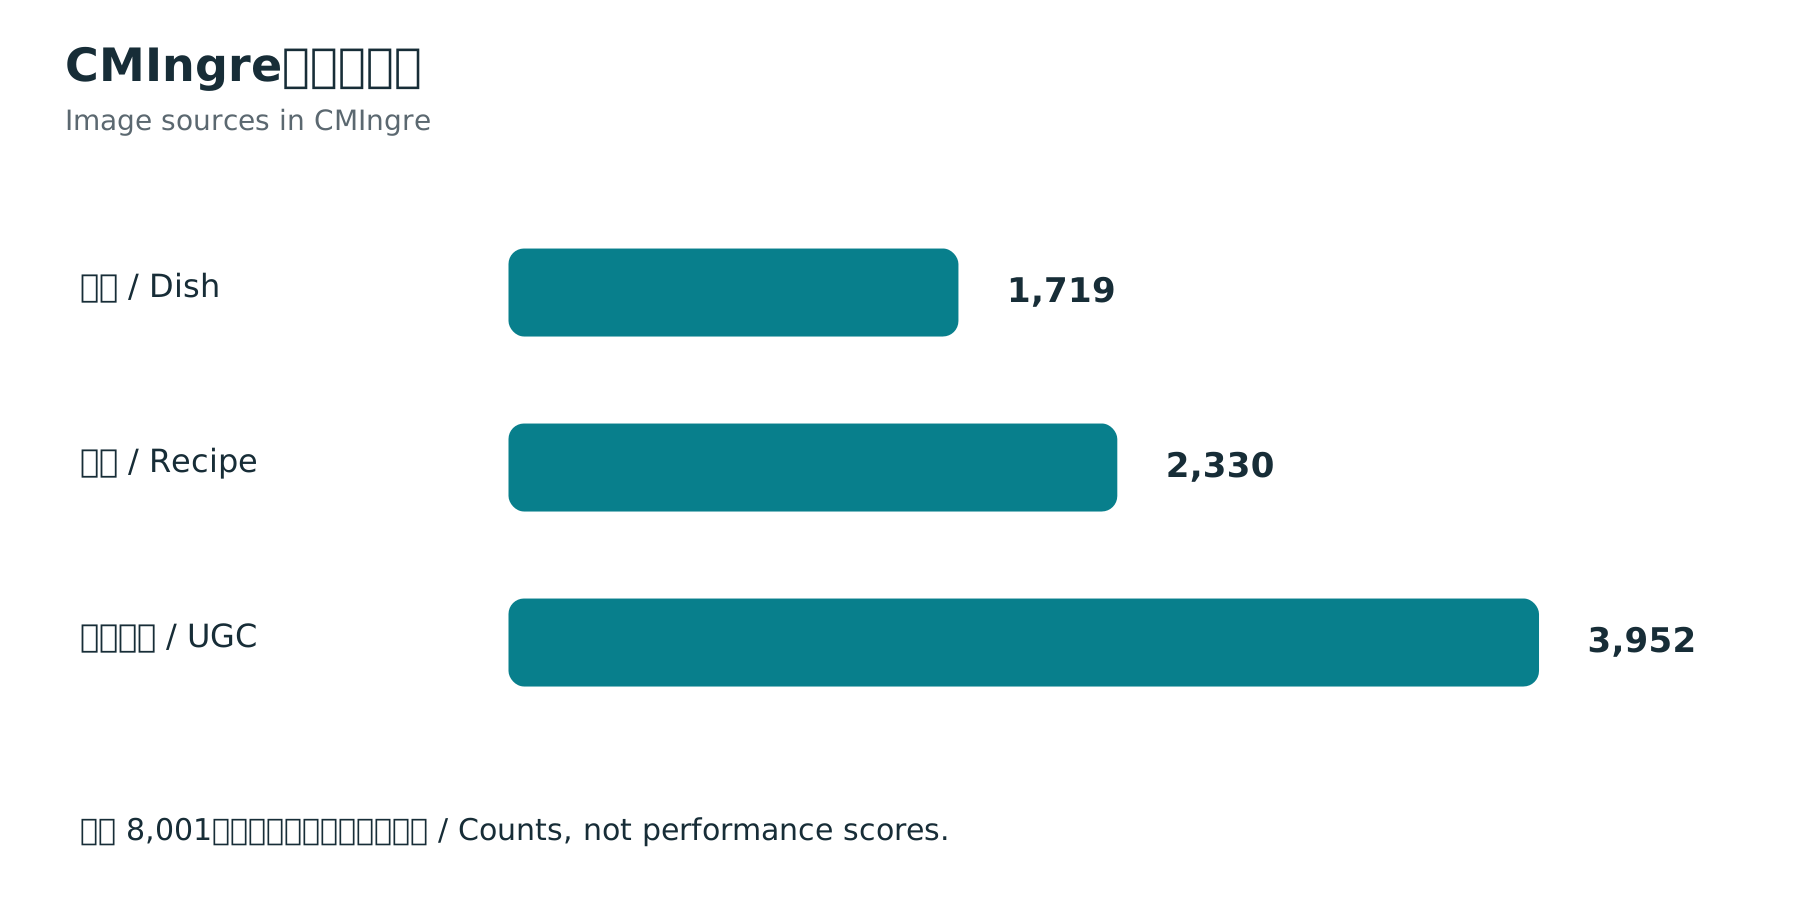
Redrawn from source counts
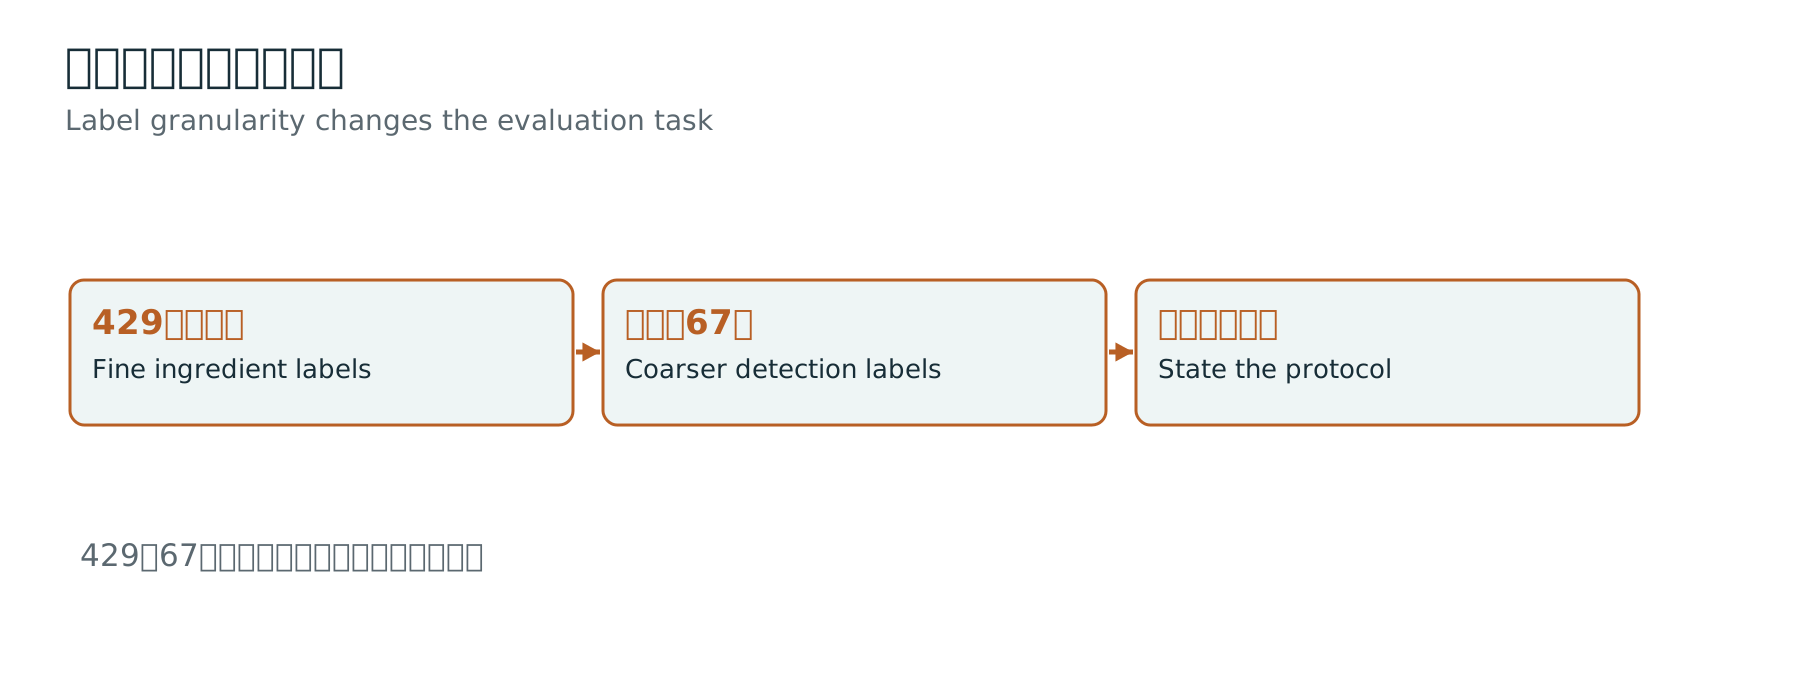
Original design
07.3
Detection and Cross Modal Retrieval Are Different Tasks
Ingredient detection concerns categories and locations within images. Cross modal retrieval concerns the ranking of matches between images and ingredient combinations. The article compares detection baselines and discusses a two stage retrieval approach using region features and adaptive pooling. Detection average precision, retrieval recall, and ranking measures must be distinguished. Better boxes can help retrieval, but the relationship is not one to one. This report does not extrapolate comparisons between particular configurations into a permanent ranking of all visual models.[R03]
In an image containing mixed ingredients, a detector may identify large meat regions but miss small additions, while a retriever still finds a suitable recipe from the overall combination. Conversely, well positioned boxes with confused categories can direct retrieval toward the wrong candidates. Improvement studies should vary localization, classification, and fusion separately before examining downstream changes. Final retrieval scores alone cannot identify which component improved. Query direction also matters: retrieving ingredients from an image and retrieving images from ingredients have different candidate sets and ambiguities. For combinations, relevance must specify whether all ingredients, some ingredients, or compatible hierarchy levels must match. Model performance becomes interpretable only after the task is defined clearly.
07.4
How Text and Images Enter the Dish Graph
The business workflow extracts ingredients, taste, texture, cuisine, and cooking methods from text, supplements ingredient and region information through image detection, and then fuses knowledge. Its connection to Microsoft GraphRAG lies in creating retrievable relationships, not in already implementing the same community summary mechanism. The Meituan case primarily demonstrates construction and product understanding, whereas the Microsoft case emphasizes discovery and synthesis using structure. Their combination is an application design proposed by this report.[R03][R01]
That combination needs an additional evidence layer. Text outputs should link to exact passages and visual outputs to regions. Fusion should occur only after product identity, version, and semantic conditions agree. If a review says that chilli was omitted last time while a photograph contains red objects, merging both into a permanent chilli attribute ignores temporal scope and visual ambiguity. Observation nodes should retain model candidates and review status before producing a query oriented attribute view. This supports complementary coverage without removing disagreement between modalities. Fusion should make evidence easier to judge rather than compress every input into an attribute table without provenance.
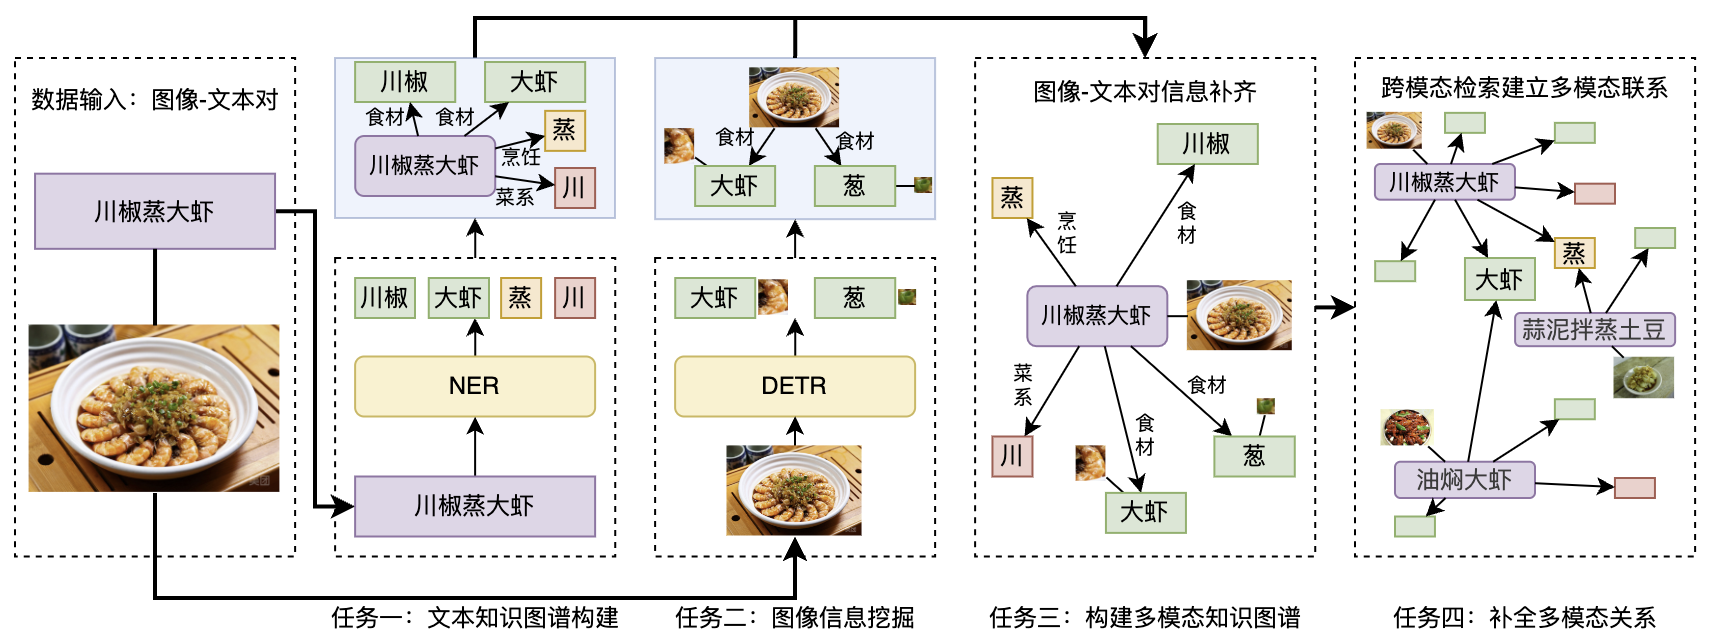
Original source labels retained
07.5
Interpreting Business Numbers Correctly
The article reports knowledge accuracy changing from 95% to 96.52%, coverage from 80% to 87.01%, and identical product recognition error from 20.38% to 2.3%. These correspond to increases of 1.52 and 7.01 percentage points and an error decrease of 18.08 percentage points, or approximately 88.71% relatively. They are reported project evaluations, not independently reproduced findings or CMIngre detection scores. Wolfram and local arithmetic were used to cross check the conversions.[R03]
Interpretation requires evaluation units, sample selection, review standards, and comparison conditions. Where inspected material does not establish these fully, confidence intervals should not be invented and transfer to new restaurants should not be promised at the same rate. Accuracy and coverage may also trade off. If newly covered attributes mainly concern easier products, an aggregate increase does not show improvement for every category. Business error changes can include system factors beyond the graph and cannot automatically establish the causal contribution of one visual model. New projects should borrow the discipline of a verifiable baseline, fixed evaluation set, and staged ablations rather than copy a percentage as a commitment. The case demonstrates feasibility; deployment benefits still need local evidence.
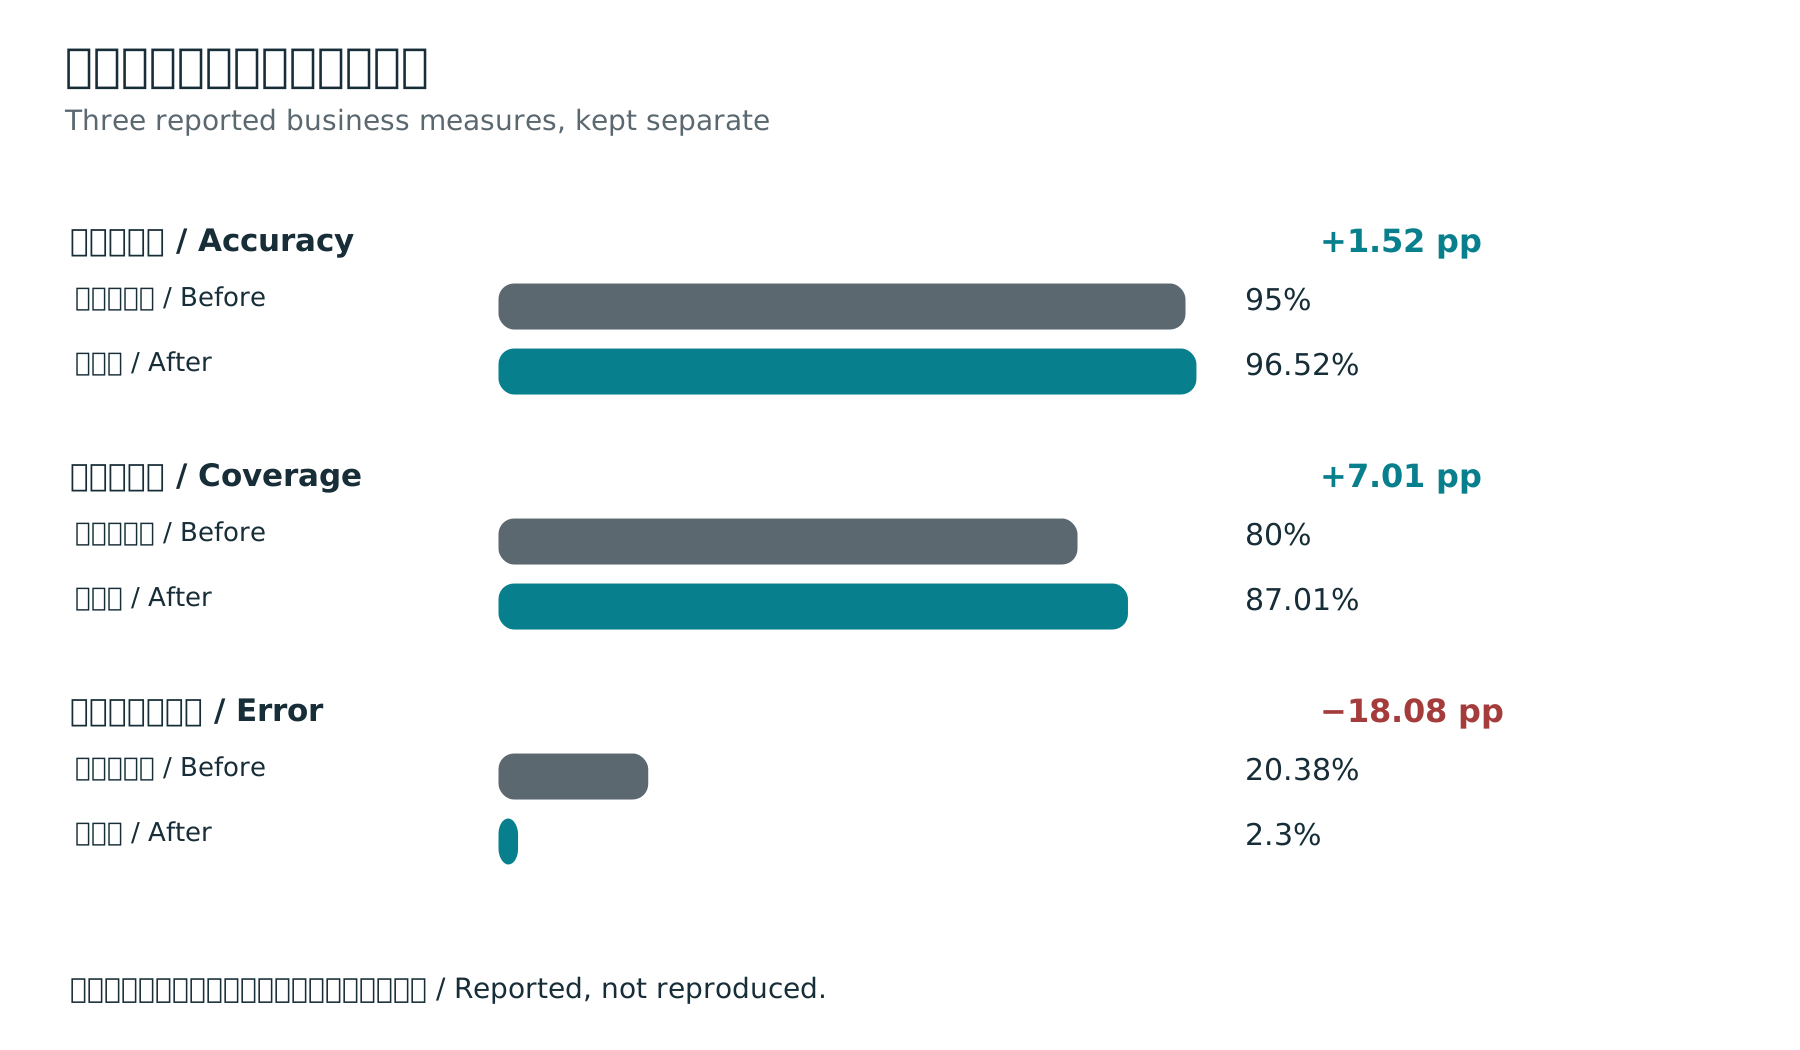
Arithmetic cross checked
07.6
Transferable Lessons and Assumptions That Need Retesting
Three design lessons can be drawn from the case: choose a business object granularity that answers real questions, use multiple sources to address gaps in a single source, and evaluate construction capabilities through actual tasks. Transfer still requires redefining data and tasks. Ingredient hierarchies can inspire component or cultural object classification, but the category system should not be copied directly. Local food detection can inspire industrial evidence modeling, while camera conditions, visibility, and error costs remain different. What transfers is a problem solving structure; specific assumptions must be tested again.
Visual ingredient recognition should especially not be presented as an allergen or nutritional safety guarantee. Invisible seasonings, processing, and cross contact are not fully represented in a photograph, and a dish name does not reliably establish absence. A system receiving such questions should return confirmed ingredient sources, applicable versions, and remaining unknowns, and identify who can verify the information. The later canteen blueprint addresses information organization and confirmation procedures rather than clinical or individual dietary decisions. This boundary enables the graph to perform appropriate work: reveal information gaps, locate evidence, reduce mistaken product matches, and clearly identify matters requiring human confirmation.