13.1
Teach How Evidence Supports a Conclusion
Introductory AI teaching can begin with a small source collection and ask students to map sources to claims and conclusions before building a complex system. Each evidence card records one verifiable statement with origin, location, time, and status. Conclusion cards need sufficient support and explicit inference links. Visual thinking makes support relations visible rather than decorative. Students see that fluent answers may depend on several records and that an unsourced node does not automatically become a fact.
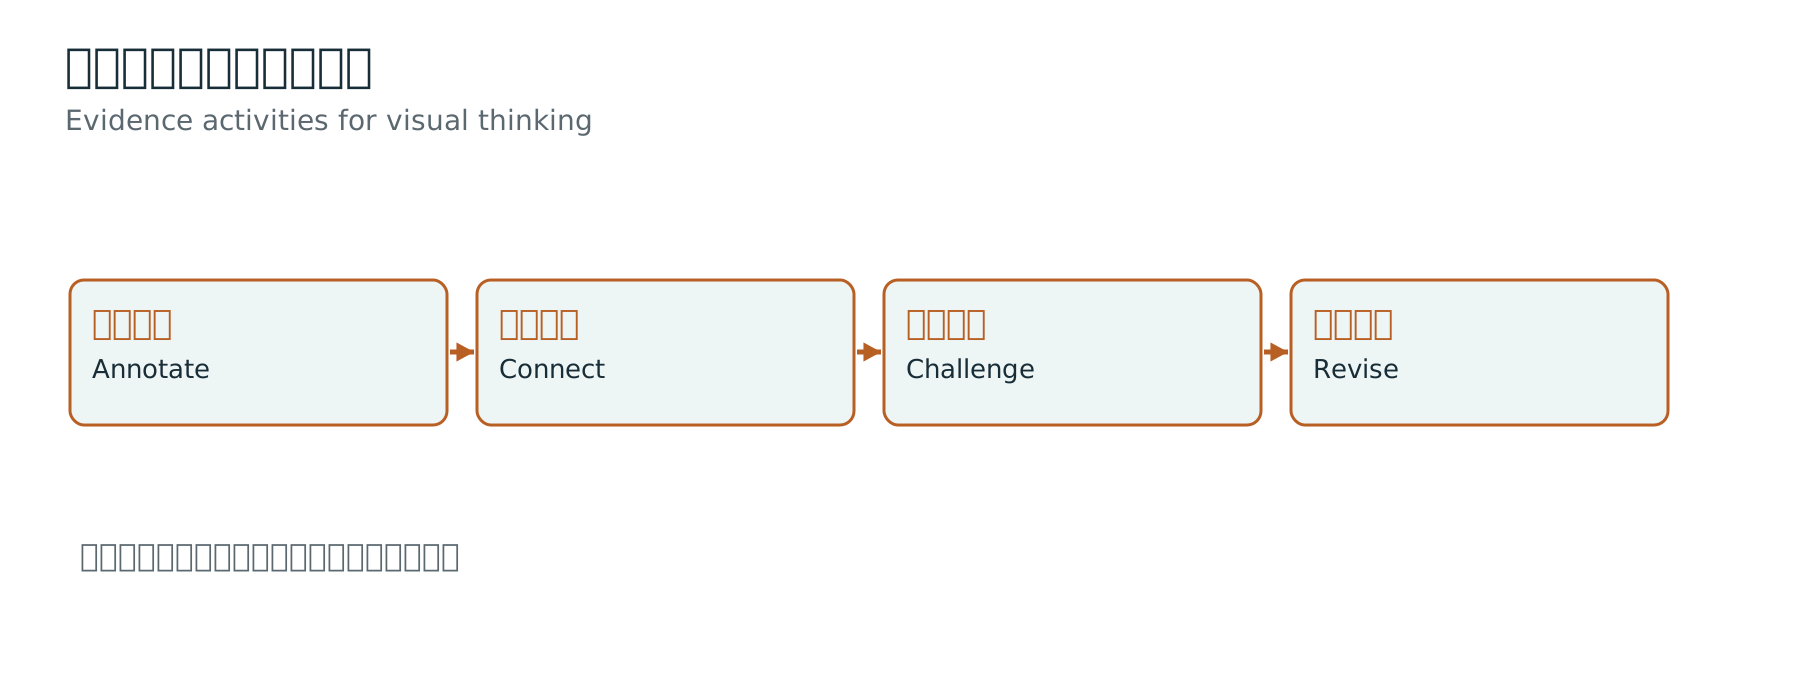
A lesson can progress from individual annotation to group agreement and class comparison. Individuals identify objects and conditions, groups negotiate identity, and the class examines why different graphs produce different answers. The goal is not one attractive layout but clear edge meanings, preserved negation, and locatable evidence. Paper cards or ordinary presentation software can precede graph databases and retrieval code. Assessment should emphasize evidence organization and error explanation rather than node count. A smaller graph with clear provenance and explicit unknowns can demonstrate more understanding than a large disordered automatic graph.
13.2
Use Controlled Activities to Understand RAG and GraphRAG
A controlled classroom activity can solve one question through three routes: prior knowledge alone, independent passage lookup, and relationship cards organizing the same evidence. The teacher supplies a factual, relational, global thematic, and unanswerable question, asking students to record discoveries, omissions, and citation locations. Abstract method differences become observable processes. The activity should not guarantee a GraphRAG victory; it should reveal that questions require different evidence structures.
Groups need equal material and time and should rotate methods. Discussion separates answer correctness, citation support, necessary evidence coverage, and overinference. Relationship cards may help a cross passage question, while drawing a graph for a simple fact may only add time. Every method should acknowledge an unanswerable question. Students can insert an erroneous edge and observe its effect, showing that structure can propagate errors as well as assist reasoning. Each group then writes a conditional conclusion, such as usefulness for relational questions in this source set, rather than claiming universal superiority. This trains the distinction between an observation and a general law.
13.3
Image Text Alignment Activities Train Visual Judgment
A multimodal activity can provide dish descriptions, images, and menu versions containing correct pairs, similar appearances, outdated photographs, and unresolved cases. Students propose candidates and list identity evidence. They distinguish observed features, inferred categories, and confirmed attributes. Seeing small red pieces is an observation; identifying them as chilli is a candidate judgment; asserting chilli in a specific product also requires identity and version evidence. Layered expression explains why visual models cannot perform all factual confirmation directly.
Three edge types can connect resources to observations, observations to candidate entities, and confirmations to attributes. Colour supports categories while written edge labels carry meaning, preserving readability for colour vision differences and monochrome printing. Students can crop images for another group and test whether lost context changes judgment. Removing a menu date or legend may undermine an apparently certain match. Assessment should reward justified rejection and requests for evidence rather than force one answer for every image. The goal of visual thinking is to expose evidence boundaries, not merely produce denser pictures.
13.4
Multiple Interpretations and Provenance in Cultural Collections
Cultural and historical sources contain alternate names, editions, legends, and scholarly disputes. A multimodal graph can connect works, people, places, image regions, and records while distinguishing historical claims, interpretations, and later traditions. An image interpreted as depicting a story does not confirm that the story's events occurred. Multiple interpretations can retain separate sources instead of assigning each object one standard answer. The graph helps compare evidence and interpretive paths rather than eliminate disagreement.
A course project can use a small public collection to connect editions and interpretations. Students identify image collections or publication versions, cropped regions, supporting texts, and uncertain dates or attributions. Bilingual terminology needs care because some cultural concepts lack exact equivalents; original terms with explanations may be preferable. Assessment can examine provenance, separation of interpretation, visual localization, and fair treatment of disputes. Public displays also require checking image conditions and attribution. The research design concerns evidence organization and does not automatically authorize copying or publishing every retrieved image. Graphs can represent cultural richness without reducing it to one category.
13.5
Practical Assignments and Verifiable Learning Assessment
An assignment can require a small evidence graph, answers to two question types, an error analysis, and a methodological reflection. The collection should be inspectable rather than graded by crawling volume. Graphs should contain a temporal condition, an uncertain observation, and a potential conflict; answers should link to source locations. Models may assist extraction if students record how candidates were reviewed. These requirements emphasize an explainable process and help teachers distinguish understanding from tool operation.
Rubrics can assess object and relation definitions, traceability, answer boundaries, correction quality, and clarity. Descriptions should distinguish a locatable but insufficient citation from direct support preserving all conditions. Peer reviewers can calibrate on one example before reviewing another project and identifying a specific improvement. Teachers can sample high scoring and disputed work to avoid grading visual polish alone. Reflection should explain where structure helped, what it cost, and where it did not help. This recognizes learning from both success and failure. An honest experiment finding no graph benefit may be stronger than an unsupported claim of improvement.
Original design
13.6
Bilingual Teaching and Cognitive Load
Bilingual teaching connects Chinese classes with English research, but stacking both languages word for word raises reading load. Chinese can frame questions and boundaries while English supplies corresponding concepts and research expression, with shared diagrams maintaining meaning. A glossary should address common confusions: grounding concerns connection to evidence, faithfulness concerns adherence to supplied evidence, and neither alone guarantees factual correctness. Figure labels should remain short, with longer explanations in prose or narration. The purpose is conceptual transfer rather than placing two essays inside every diagram.
A lesson can move through question, diagram, activity, discussion, and transfer, introducing few concepts at each stage. Experiencing retrieval difficulty before seeing graph structure can be more accessible than starting with a complete architecture. Stable colours and edge meanings reduce unnecessary cognitive effort. Paper, table, and code entry routes can serve different backgrounds while sharing tasks and assessment. Students finally transfer the method to a small disciplinary problem and explain changed conditions. This preserves rigor without presenting GraphRAG as either a programmer only black box or a slogan capable of solving every knowledge problem.