12.1 Evaluate the full chain
Knowledge graph evaluation(知识图谱评估)must connect component quality to application outcomes. A system can have accurate entity extraction but poor identity resolution, fast queries but incomplete evidence, or fluent answers that omit important contradictions. Evaluating each component separately identifies defects, while evaluating the complete workflow shows whether those defects matter to users. Neither level replaces the other. The proposed evaluation plan uses both a diagnostic suite and a set of representative research tasks.
The diagnostic suite covers parsing, entity detection, linking, relation extraction, qualifier preservation, validation, retrieval, and answer generation. Each stage receives inputs representative of those it will see in operation. Testing a relation extractor only with perfect entity labels can measure its isolated capability, but it does not measure deployed performance after entity errors. Both results can be useful if the report clearly identifies which setting produced each score.
12.2 Extraction metrics with a worked example
Precision(精确率)is the fraction of predicted positive items that are correct. Recall(召回率)is the fraction of reference positive items recovered. F1 is their harmonic mean. Suppose a synthetic evaluation contains 90 correct extracted relations, 10 incorrect extracted relations, and 30 missed reference relations. Precision is 90 divided by 100, or 0.90. Recall is 90 divided by 120, or 0.75. F1 is approximately 0.8182. These are illustrative counts, not results from a real extractor.

The definition of a correct relation must be fixed before scoring. An experiment may require exact entity identities and a relation label, while another also requires the correct dataset version and polarity. These evaluation contracts produce different numbers. A score should therefore be accompanied by the matching rule and the annotation policy. Otherwise, two systems may appear comparable while one is being rewarded for much less complete extraction.
Micro averaging(微平均)aggregates counts across categories, allowing frequent classes to dominate. Macro averaging(宏平均)averages class level scores, giving rare classes more influence. Both can be informative. A research graph with many easy authorship relations and few difficult contradiction relations can achieve a high micro score while performing poorly on its most important analytical relation. Reporting per relation results helps prevent that failure from disappearing into an overall average.
12.3 Ranking and retrieval metrics
Mean reciprocal rank(平均倒数排名)averages the reciprocal of the rank assigned to a correct answer. For three synthetic queries with correct answer ranks one, two, and four, the mean reciprocal rank is approximately 0.5833. Hits at one is one third; Hits at three is two thirds. These metrics describe ordering under the defined candidate set. They do not measure whether the answer is sufficiently supported by evidence or whether the candidate set includes every valid answer.
Knowledge graph completion benchmarks sometimes use filtered ranking to avoid penalizing a model for ranking another known correct answer ahead of the test target. A report should state the filtering policy and which known triples were used. Filtering can make benchmark comparison more consistent, but it does not solve unknown truth in an incomplete graph. Real deployment also requires a decision about when to show a candidate, when to abstain, and whether the relation is suitable for automatic acceptance.
Retrieval evaluation should include evidence recall at the chosen context budget, not merely whether a relevant document appears somewhere in a long list. A system may find the correct paper but omit the table footnote needed to interpret its result. For multi source questions, evaluation should check whether the retriever finds all essential evidence components and relevant contradictions. This gives a more realistic view of what the generator can reasonably answer.
12.4 Leakage and distribution shift
Data leakage(数据泄漏)occurs when evaluation information improperly influences training or system design. In graph tasks, inverse relations and near duplicate records can create subtle leakage. If a test triple has an equivalent inverse stored in the training graph, predicting it may require little genuine generalization. If versions of the same paper appear in both training and test sets, extraction performance can benefit from repeated wording. Split design should account for these dependencies.
Temporal evaluation is useful when the application will predict or retrieve information that arrives later. The model and graph should use only information available before the cutoff, and evaluation should reflect the later period. This includes auxiliary text and embeddings: a graph split is not truly temporal if the language model input contains future descriptions. The report should identify unavoidable exposure risks and avoid claiming a perfect historical simulation when the training data of a foundation model are unknown.
Distribution shift(分布漂移)can arise from new domains, languages, document layouts, or source practices. A system trained on research abstracts may perform poorly on tables and technical reports. Evaluation should reserve realistic out of domain cases and monitor changes after deployment. A falling confidence score may reveal some shifts, but confident mistakes remain possible. Periodic review of randomly sampled accepted outputs is therefore a useful complement to automated monitoring.
12.5 Faithfulness and human evaluation
Human evaluation should use clear criteria and evidence access. Reviewers can separately assess answer correctness, source support, completeness, handling of uncertainty, and usefulness. A single “good answer” score mixes these dimensions and makes disagreement difficult to interpret. Reviewers should not be shown system identities when that information could bias judgment. When several reviewers evaluate the same sample, disagreements should be analyzed rather than averaged away without explanation.
Language model judges can help scale preliminary evaluation, but they should be calibrated against human judgments for the task. They may favor fluent language, share biases with the generating model, or overlook unsupported details. A practical workflow uses automatic checks for clear structural failures, model based assessment for triage, and human review for a representative sample and consequential cases. The evaluation report should state which conclusions depend on each method.
Uncertainty intervals should reflect dependence in the data. Many claims from one document are not independent observations. Resampling individual claims can give overly narrow intervals if errors cluster by document. A document level or source family level resampling strategy may better reflect the unit of variation. The chosen statistical method should match the study design, and small sample results should be presented as preliminary rather than made precise through excessive decimal places.
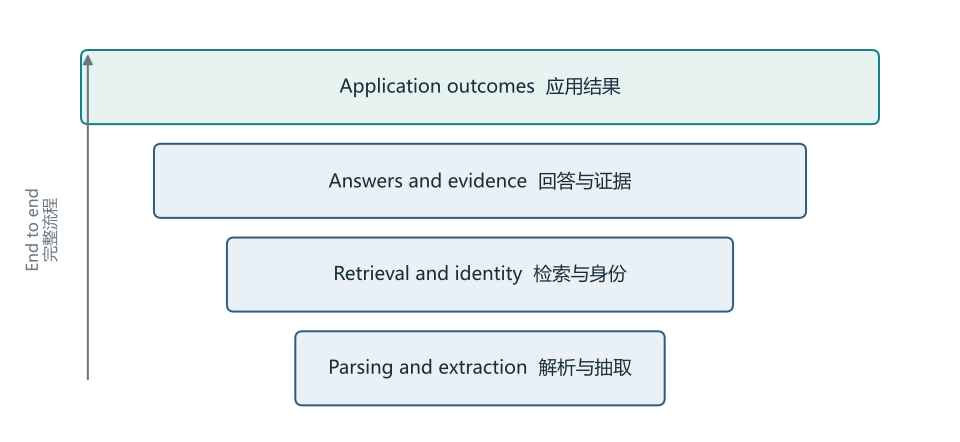
Evaluation combines component diagnostics with complete application outcomes. Higher level success depends on lower level quality but is measured separately.
Original figures retain bilingual labels. Read alongside the explanation; open for a larger view.12.6 Governance and evidence quality
Governance defines responsibility for the graph's meanings, records, and uses. Each important dataset should have an owner, permitted uses, update policy, and correction route. FAIR principles emphasize findability, accessibility, interoperability, and reusability in scientific data stewardship [49]. Applying these principles to a graph requires more than publishing an endpoint. Users need understandable identifiers, metadata, access conditions, and enough context to reuse the information correctly.
Quality dimensions can conflict. A very strict acceptance policy may improve precision while reducing coverage. A broad public graph may increase reuse while creating privacy or licensing problems for particular sources. The appropriate policy depends on the task and the rights associated with the data. A governance record should explain the tradeoff and identify who can revise it. This gives users a basis for interpreting omissions instead of assuming that the graph represents all available knowledge.
The proposed release decision combines minimum quality requirements with a realistic maintenance plan. It asks whether the system answers its competency questions accurately, whether important errors can be corrected, and whether the team can keep sources current. A graph that passes a one time demonstration but has no update owner is not ready to become a dependable source for an agent. Sustainable operation is part of quality, not an optional activity after deployment.
| Layer | Measure or check | What it does not establish |
|---|---|---|
| Extraction | Precision, recall, qualifier accuracy | Scientific truth of the source |
| Identity | Linking accuracy, merge and split errors | Completeness of the entity catalog |
| Retrieval | Evidence recall at a fixed budget | Faithfulness of generated prose |
| Answer | Correctness and citation support | Permission to execute an action |
| Agent | Task completion, policy compliance, recovery | Reliability outside the tested scope |
| Operation | Freshness, repair time, lifecycle cost | Value without a useful task |