Executive abstract
Knowledge graphs(知识图谱)make the identities, relationships, and context of information explicit. Their practical value comes from connecting records that would otherwise remain separated, expressing what those connections mean, and preserving the evidence needed to interpret them. A graph becomes useful knowledge infrastructure when people can determine which entity a statement concerns, where the statement came from, when it applies, and what conclusions can legitimately follow. A visually impressive network alone does not establish any of these properties.
This report examines knowledge graphs as an integrated research and engineering subject. It connects schema design(模式设计), entity extraction(实体抽取), relation extraction(关系抽取), storage(知识存储), graph computation(图计算), reasoning(知识推理), applications, and artificial intelligence agents(智能体). The central argument is that reliable performance depends on agreements between these stages. An extraction model cannot repair an ambiguous identity policy. A fast database cannot make an unsupported relationship true. An agent cannot safely act on a graph whose permissions, timestamps, or evidential status are missing.
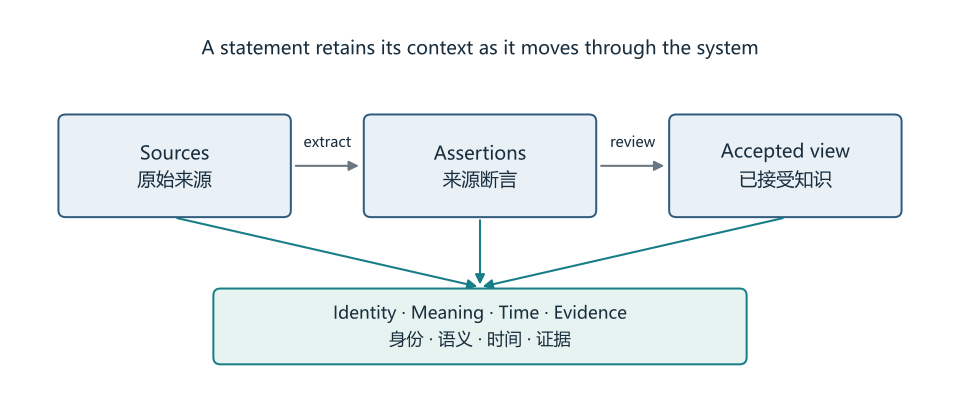
Three distinctions organize the analysis. First, a mention in a document differs from the entity it denotes. Second, a source assertion differs from an accepted fact and from a model prediction. Third, a graph algorithm, a logical proof, and a causal conclusion answer different questions. Keeping these distinctions visible improves system design and prevents misleading claims about what a knowledge graph understands. They also explain why storing everything as an undifferentiated collection of triples often produces disappointing results.
The report combines a narrative literature review with original architectural analysis and synthetic worked examples. Foundational surveys provide orientation; standards establish formal semantics; primary research papers illustrate specific methods. Consensus and SciSpace were used for literature discovery, followed by checks against original publication records and accessible paper pages. Wolfram was used to verify a small PageRank calculation. Search indexes sometimes disagree about publication years or author names, so final references favor the identifiable published version where available. The evidence search was conducted on 1 October 2026. This is a selective integrative review, not an exhaustive systematic review or a new benchmark study.
Recent work on graph retrieval augmented generation and graph guided agents shows several productive ways to combine structured knowledge with language models. The evidence supports investigating these combinations for questions that require explicit connections, provenance, or controlled updates. It does not justify assuming that a graph always improves a retrieval system. Construction errors, retrieval expansion, stale summaries, and additional processing costs can offset the benefits. A strong evaluation therefore compares graph based methods with simpler alternatives under the same corpus, model, access policy, and cost budget.
An original example called the Research Evidence Graph runs through the report. It links documents, claims, people, methods, datasets, and experiments. All people, organizations, dates, and experimental records in this example are fictional unless a passage explicitly identifies a real publication. The example demonstrates how a graph can support a research assistant without confusing an author's claim with independent confirmation. It also provides a practical route from a small local project to a governed organizational system.
Reading guide
Chapters 1 and 2 explain meaning and schema. Chapters 3 through 6 cover construction and storage. Chapters 7 and 8 separate computation from reasoning. Chapters 9 through 11 examine applications, language models, and agents. Chapters 12 through 14 address evaluation, implementation, and research priorities. English terms receive Chinese annotations on first use and in the glossary. Figures are original explanatory diagrams; numeric examples are synthetic calculations rather than empirical findings. Square bracket numbers point to the reference list.