7.1 What computation contributes
Knowledge computation(知识计算)is a broad term. In this report it includes querying explicit relationships, calculating structural properties, learning representations, and evaluating derived measures. These operations can reveal useful patterns without establishing new logical truths. A centrality score can identify a structurally prominent paper, but it does not prove that the paper is correct. A cluster can identify densely connected entities, but it does not prove that they belong to a naturally occurring category. The interpretation comes from the modeled relationships and the question being asked.
Every computation should begin with a graph specification. The specification states which node and edge types are included, whether direction matters, how weights are defined, how duplicate edges are handled, and which time interval is covered. In a research graph, treating CITES, CONTRADICTS, and AUTHORED_BY as one generic edge would mix different kinds of meaning. The resulting score might be mathematically well defined yet scientifically difficult to interpret. A reproducible analysis therefore records the projection as carefully as the algorithm.
7.2 Traversal reachability and shortest paths
Traversal(遍历)visits connected records according to a rule. Breadth first search finds shortest paths measured by the number of edges in an unweighted graph. Weighted shortest path methods solve a different problem: they minimize a sum of edge costs under the algorithm's assumptions. A cost might represent travel time, processing effort, or another quantity. It should not be chosen merely because the graph already contains a numerical attribute.
Suppose a dependency graph connects a research claim to the studies and datasets on which it relies. Reachability can answer which claims might be affected by correcting a dataset. The reachable set is a list of potentially affected records, not a judgment that every conclusion is invalid. A review process still needs to examine how each claim uses the dataset. This distinction allows a graph algorithm to support a decision without pretending to complete the whole decision.
The report's synthetic directed graph has four nodes, A, B, C, and D, and five edges: A to B, A to C, B to C, C to A, and D to C. From D, the shortest path to B is D to C to A to B, with length three. There is no directed path from A to D. An undirected rendering would hide that asymmetry and suggest a connection the directed model does not allow. Figure 7 preserves the arrows to make the distinction visible.
7.3 Adjacency matrices and walk counts
An adjacency matrix(邻接矩阵)records which node pairs are connected. For the synthetic graph, rows represent source nodes and columns represent target nodes in the order A, B, C, D. An entry of one denotes an edge. Multiplying the adjacency matrix by itself counts two step walks in this unweighted graph. The entry for D to A becomes one because D to C to A is available. The entry for A to A is also one because A to C to A returns to the start.
A walk(游走)can revisit nodes; a simple path cannot. This distinction matters when matrix powers are interpreted. Counting walks of length three does not count only three edge simple paths. It can include repeated vertices and cycles. Moreover, a two edge walk that combines different relationship types may have no useful semantic interpretation. Matrix operations preserve the chosen algebraic structure, but they do not automatically supply the meaning of a composed relation.
The synthetic matrix calculation was checked with Wolfram using MatrixPower. Its purpose is pedagogical: it shows exactly what a graph computation returns and what it leaves unspecified. A practical system can use sparse matrices for large projections, but numerical efficiency does not change the interpretation. The report does not treat walk counts as probabilities, causal effects, or independent pieces of evidence.
7.4 A reproducible PageRank example
PageRank(页面排名算法)assigns a stationary distribution to a random walk with teleportation. The original work developed the idea for ranking web pages [28]. The same mathematical construction can be applied to other directed graphs, provided that the interpretation of a transition is clear. This report uses a damping factor of 0.85 and uniform teleportation across the four synthetic nodes. Each node divides its outgoing transition probability equally among its outgoing edges. There are no dangling nodes in this example.

In the displayed equation, r is the column vector of scores, P is the row stochastic transition matrix, and v is the uniform teleportation vector. Solving the linear system gives A = 0.3725268513, B = 0.1958239118, C = 0.3941492369, and D = 0.0375000000. The scores sum to one. Wolfram LinearSolve independently returned the same values and an exactly zero stationary residual in the rational calculation [47]. A local numerical calculation is included in the report's reproducibility checks.
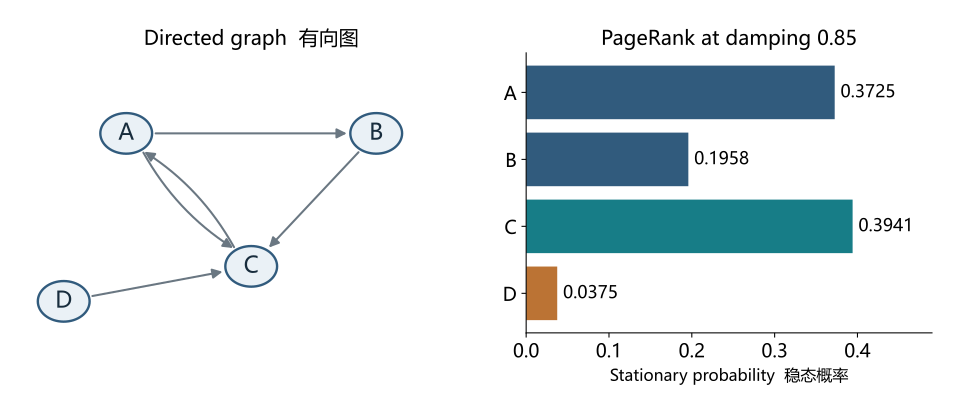
Synthetic directed graph and its PageRank distribution at damping 0.85. Scores were checked with Wolfram and a local linear system calculation; they are not empirical research results.
Original figures retain bilingual labels. Read alongside the explanation; open for a larger view.Node C receives the highest score because it receives transitions from A, B, and D, while A benefits from C's outgoing edge. D has no incoming links, so its score is its teleportation share. These are properties of this specific projection and transition rule. If nodes represented papers, the scores would describe structural prominence under the model. They would not measure experimental validity, methodological rigor, or the social value of the research.
Personalized PageRank changes the teleportation distribution to emphasize selected seed nodes. That can be useful for retrieving a neighborhood relevant to a user's question. The result remains sensitive to seed selection, relation filtering, and graph completeness. A node can receive a low score because it is poorly connected in the database, not because it is irrelevant in reality. A retrieval system should therefore combine structural ranking with lexical or semantic evidence when coverage is uneven.
7.5 Communities and similarity
Community detection(社区发现)groups nodes according to a structural objective. The Leiden algorithm addresses connectivity problems that can occur with Louvain and provides guarantees under its formulation [29]. For a research graph, communities may help organize a large citation network into navigable regions. The labels assigned to those regions still require interpretation. A community could reflect a method, a language group, a historical period, or citation practices rather than a coherent scientific subject.
Resolution settings and projection choices can change the grouping. A system should report these choices and test whether the interpretation survives reasonable alternatives. For exploratory browsing, approximate groupings can be useful. For a claim about the structure of a discipline, stronger validation is needed. Comparing clusters with expert labels, examining boundary cases, and checking stability over time can reveal whether the algorithm has found a useful analytical unit.
Similarity measures also depend on representation. In an undirected version of the synthetic graph, B has neighbors A and C, while D has neighbor C. Their Jaccard similarity is one divided by two, or 0.5. This number expresses overlap between two neighbor sets. It is not a probability that B and D should be connected. A learned link prediction model may use such overlap as a feature, but additional assumptions and validation are needed before converting it into a recommendation.
7.6 Representation learning and graph neural networks
Knowledge graph embeddings(知识图谱嵌入)map entities and relations to numerical representations so that a scoring function can distinguish plausible triples. TransE models relations as translations between entity vectors [21]. ComplEx uses complex valued representations to model a broader range of relational patterns [23]. RotatE represents relations through rotations in complex space [24]. These models differ in their inductive biases, so the relation patterns present in a dataset affect which assumptions are useful.
A small synthetic illustration makes the scoring idea concrete. Let an entity vector be (1, 0), a relation vector be (0, 1), and two candidate targets be (1, 1) and (3, 1). Under a Euclidean TransE distance, the first candidate has distance zero and the second distance two. The first therefore receives the more favorable score under this chosen geometry. These vectors were manually constructed for explanation; they were not learned from data and do not demonstrate predictive accuracy.
Graph neural networks(图神经网络)update representations by combining information from neighboring nodes and edges. R-GCN adapts graph convolution to relational data through relation dependent transformations [25]. NBFNet develops a learned path based framework inspired by a generalized Bellman–Ford formulation [26]. These approaches show how topology and relation semantics can enter learning. Their outputs still require evaluation under the deployment setting, particularly when new entities or relation types appear after training.
| Method | Main modeling idea | Interpretive limit |
|---|---|---|
| TransE [21] | Relation as vector translation | Plausibility score is not a factual proof |
| DistMult [22] | Tri-linear scoring | Symmetric score limits asymmetric modeling |
| ComplEx [23] | Complex valued factorization | Requires task specific training and evaluation |
| RotatE [24] | Relation as complex rotation | Learned relational patterns remain predictions |
| R-GCN [25] | Relation specific message passing | Quality depends on available neighborhoods |
| NBFNet [26] | Learned generalized path computation | Explanatory paths do not imply causal effects |
7.7 Reproducibility and interpretive limits
An analytical result should include graph snapshot, projection, algorithm version, parameters, random seed when applicable, and output interpretation. For approximate algorithms, the team should record tolerances and convergence criteria. For learned models, it should record training data, negative sampling, validation policy, and checkpoint. These details enable another analyst to determine whether a changed result reflects new knowledge, different modeling choices, or numerical variation.
The strongest use of graph computation is often to narrow a human or automated investigation. It can prioritize nodes for inspection, expose disconnected records, identify dependencies, or rank candidate evidence. Its role becomes clearer when the system names the question it solves. A graph score should enter an application with an explicit interpretation and a tested decision rule, rather than acquiring authority merely because it was computed over a knowledge graph.