2.1
From visual perception to visual reasoning
Visual thinking did not originate with contemporary AI. In Visual Thinking, first published in 1969, Rudolf Arnheim argued for a close connection between perception and thought, challenging a division in which seeing is passive input while reasoning belongs exclusively to language.[1] This tradition draws attention to classification, organization, and abstraction within visual activity. A broad theoretical argument, however, does not establish that adding images improves every course. Instructional design must still identify the information supplied by a representation and the operations performed by its learners.
Three levels help distinguish visual activities. Recognition identifies an exit symbol on a hotel plan. Relational understanding establishes how reception, rooms, and escape routes connect. Reasoning predicts how a change in staffing might affect queues and response times during a busy period. An AI system may label the visible objects convincingly while remaining unreliable on the latter two tasks. Separating image recognition, structural interpretation, and situated simulation is therefore a necessary starting point for evaluating visual capabilities.
An external representation is also more than a copy of a fully formed internal idea. Drawing several nodes may reveal inconsistent categories. Extending a process may expose repeated authorization. Placing two time scales together may show that short-term conversion growth accompanies a decline in repeat business. In such cases, the representation participates in the formation of the idea. Research should consequently examine how people interact with representations, as well as the appearance of the final image.
2.2
Grandin and the scope of her contribution
In Visual Thinking, published in 2022, Temple Grandin combines lived experience, professional practice, and research discussion to advocate recognition of different ways of thinking. She distinguishes imagery concerned with detailed objects from thinking concerned with patterns and spatial relationships.[2] The educational implication is to widen the tasks through which competence can become visible, including drawing, modeling, observation, design, and practical problem solving. The book is not treated here as a randomized experiment, and one accomplished person's experience cannot determine the capabilities, support needs, or developmental paths of all autistic people.
The attachments summarize the two modes through the analogy of building a train and making a train operate. This can initiate discussion, but it should not function as a strict classification rule. Object imagery is not restricted to static appearance, and spatial reasoning is not automatically causal reasoning. Understanding power transmission requires domain knowledge, mechanical relationships, and experience. A person who draws an apparatus well may also reason effectively about its operation. A learner who prefers language can acquire diagrammatic competence through practice. Educational design should translate an analogy into observable task requirements rather than infer ability directly from preference.
Reflection on Chinese education also benefits from moving from general diagnosis to questions that can be examined. Does a course reward only extended prose? Can learners demonstrate understanding through models and diagrams? Do practical work, design, and error correction contribute to assessment? Assignments, classroom records, and marking criteria can answer such questions. The possibility that lower-scoring students possess overlooked strengths is a useful educational hypothesis. Claims that large numbers of them are necessarily visual geniuses, or that one cognitive mode is the exclusive source of innovation, go beyond the available basis.
2.3
Imagery external representation and visual literacy
Mental imagery concerns internal visual or spatial representation without corresponding immediate sensory input. External representations are diagrams, objects, symbols, and interfaces that can be shared and manipulated. They may support one another, but they are not identical. Someone who does not experience vivid imagery may still reason effectively with paper, coordinates, relational diagrams, and computational tools. A classroom should therefore avoid requiring every student to report the same inner picture. It should support several routes to understanding.
Visual literacy concerns the ability to read, interpret, evaluate, and create visual information. In an AI environment, it additionally includes examining provenance and judging whether presentation choices mislead. Visualization usually denotes the design or computation that maps information into visual form. Visual thinking can use visualization, but it asks a broader question about what a person does in order to understand. Visualization often emphasizes encoding, while visual thinking emphasizes cognitive activity. Maintaining the distinction prevents fluency with software from being mistaken for an improvement in reasoning.
Visual analytics combines interactive visualization with analysis so that people can ask questions, change filters, compare outcomes, and develop explanations. Diagrammatic reasoning concerns inference supported by graphical structure. Design thinking concerns framing problems, prototyping, and iteration; it frequently uses visual thinking but is not synonymous with it. A knowledge graph is a data structure with typed entities and relations, rather than any map containing connected nodes. Instruction may begin with accessible analogies while progressively clarifying these boundaries.
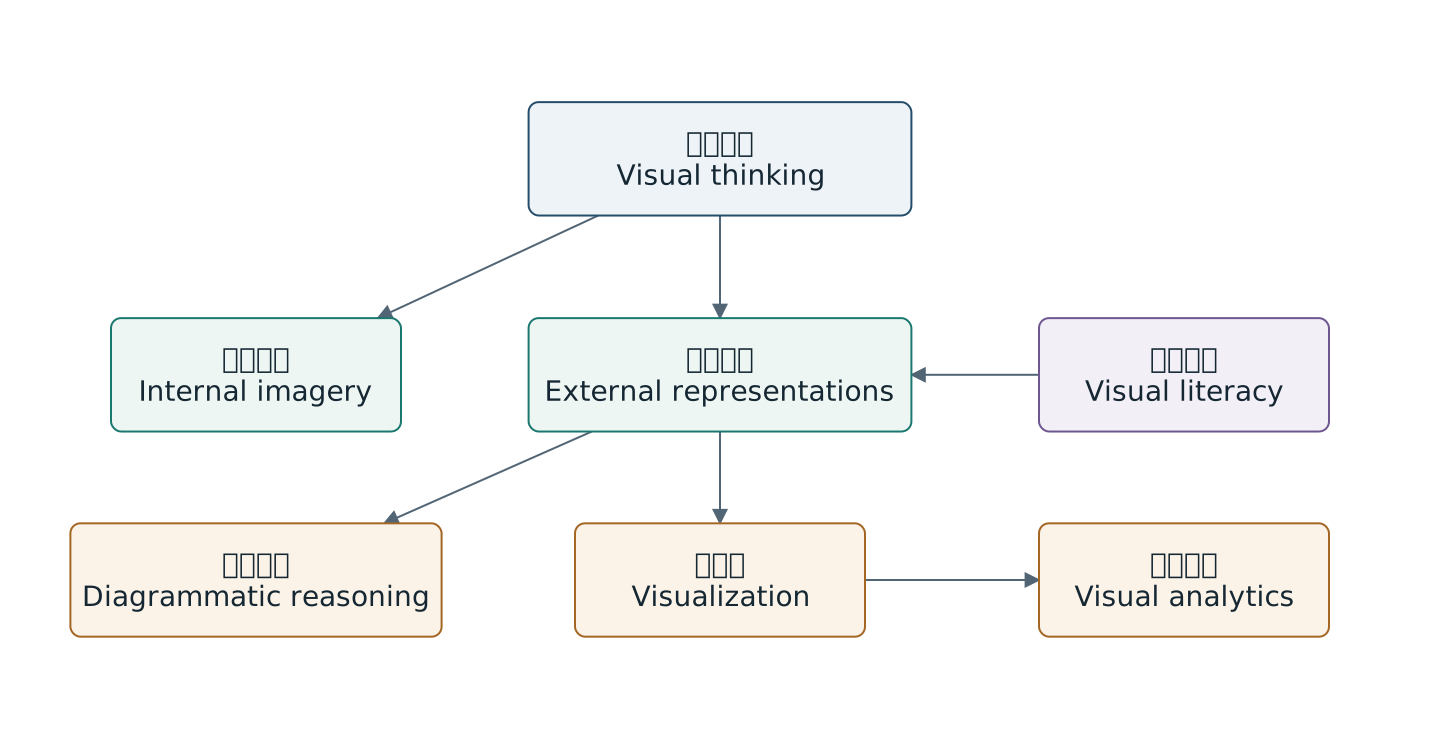
Conceptual design proposed in this report
Figures retain bilingual labels; the surrounding text explains them. Open for a larger view.2.4
Choosing representations for a task
Representation selection can begin with the verb in the question. Listing may require a checklist. Comparison may require a table or charts on a common scale. Sequence calls for a process representation. Connections call for a network. Causal inquiry needs explicit assumptions. Spatial conflicts may need a plan. Parameter changes may require an interactive model. A task can use several forms, but each form should have a defined analytical responsibility. A graphic without such a responsibility usually adds viewing effort without adding understanding.
Different representations of the same hotel problem ask different questions. A problem tree identifies possible factors. A time series shows when a change occurred. A channel comparison shows where it was concentrated. A workflow shows how information and responsibility move. A revenue curve explores trade-offs under stated assumptions. These forms are not interchangeable. A list of possible causes cannot establish causation, and a fitted curve cannot independently justify a real pricing decision. Later cases show how representations can constrain and check one another.
| Form | Suitable question | Main limitation |
|---|---|---|
| Problem tree | How might factors be organized | Branches do not establish causation |
| Concept map | How concepts relate | Edges need meanings |
| Process and swimlane | Who acts under which conditions | Exceptions and authority are necessary |
| Data chart | Compare magnitude distribution and change | Definitions and scales constrain interpretation |
| Spatial plan | Locate distances and conflicts | Scale and dimensions need accuracy |
| Interactive model | What follows changed assumptions | Model behavior is not empirical confirmation |