23.1
From viewing graphics to manipulating models
Static graphics preserve and compare states, while interactive graphics support exploration. Value comes from proposing a hypothesis, changing a parameter, observing a result, and explaining the difference. Instruction should define the relationship before deciding which controls to expose. Unrestricted sliders without a guiding question may produce engagement without transferable understanding. Interaction still needs objectives, constraints, and checks.
A four-step sequence is prediction, change, comparison, and explanation. Students predict how higher variable cost affects a profit optimum, adjust it, inspect the curve, and explain the difference. Predictions expose prior models; explanations reveal whether learners merely followed the display. AI can ask further questions without giving every result immediately.
Important states should be retained with parameters and interpretation. Defaults, reset, named states, exported tables, and overlaid curves support comparison. Static and interactive forms serve complementary roles in exploration and record keeping.
23.2
Understanding parameter updates through gradient descent
A simple quadratic can introduce parameter updates before a large neural network. Loss is the squared difference between a parameter and a target. A learner starts at an initial value and follows gradient updates. The display shows the curve, current position, and trajectory. The simplification teaches step size, direction, and iteration, not the claim that all training problems have this shape.
Small, medium, and large steps can illustrate slow progress, faster approach, and oscillation or divergence. AI organizes observations while computation produces the trajectory. Students distinguish an apparently descending curve from convergence under specified conditions and avoid generalizing one example to every loss surface.
The same process appears as a rule, numerical table, and trajectory. Learners calculate one step and locate it visually, then explain changing update magnitude. The rule specifies the operation, the table preserves values, and the graphic shows change. Inconsistency in one form can be detected through the others, providing a concrete mutual-checking exercise.
23.3
Sensitivity is not all of uncertainty
Sensitivity analysis changes an input and observes an output. Uncertainty also concerns model structure, measurement, sampling, and unknown events. A demand-slope slider does not cover all hotel uncertainty. An interactive example should state both permitted variations and omitted mechanisms so that adjustable bounds are not mistaken for reality's boundaries.
Students can distinguish parameter ranges, evidence quality, structural assumptions, and external changes. Some can be quantified; others need scenarios, new data, or judgment. AI can enumerate possibilities but should not assign precise probabilities without evidence. Clear scenario labels are preferable to unsupported decimal precision.
Results should guide action. Strong dependence on one parameter may justify collecting better information. Stability over a range may justify a small trial. The aim is to identify where further investigation matters, not display every possible curve. Learners explain the next step supported by the graphic.
23.4
Acceptance criteria for interactive artifacts
Acceptance checks include units, valid ranges, defaults, extremes, reset, and recorded output. Changes must follow explicit rules rather than randomly plausible trends. Random simulation needs a seed or reproducible procedure and a distinction between one trajectory and a distribution. Saved states should reproduce important results.
Controls need readable values and alternative input, labels alongside color, pause for motion, and accessible explanations. A static summary should preserve the main relationship for those unable to interact. An independent user then completes a task and interprets the result. Technical operation and learning usability require separate checks.
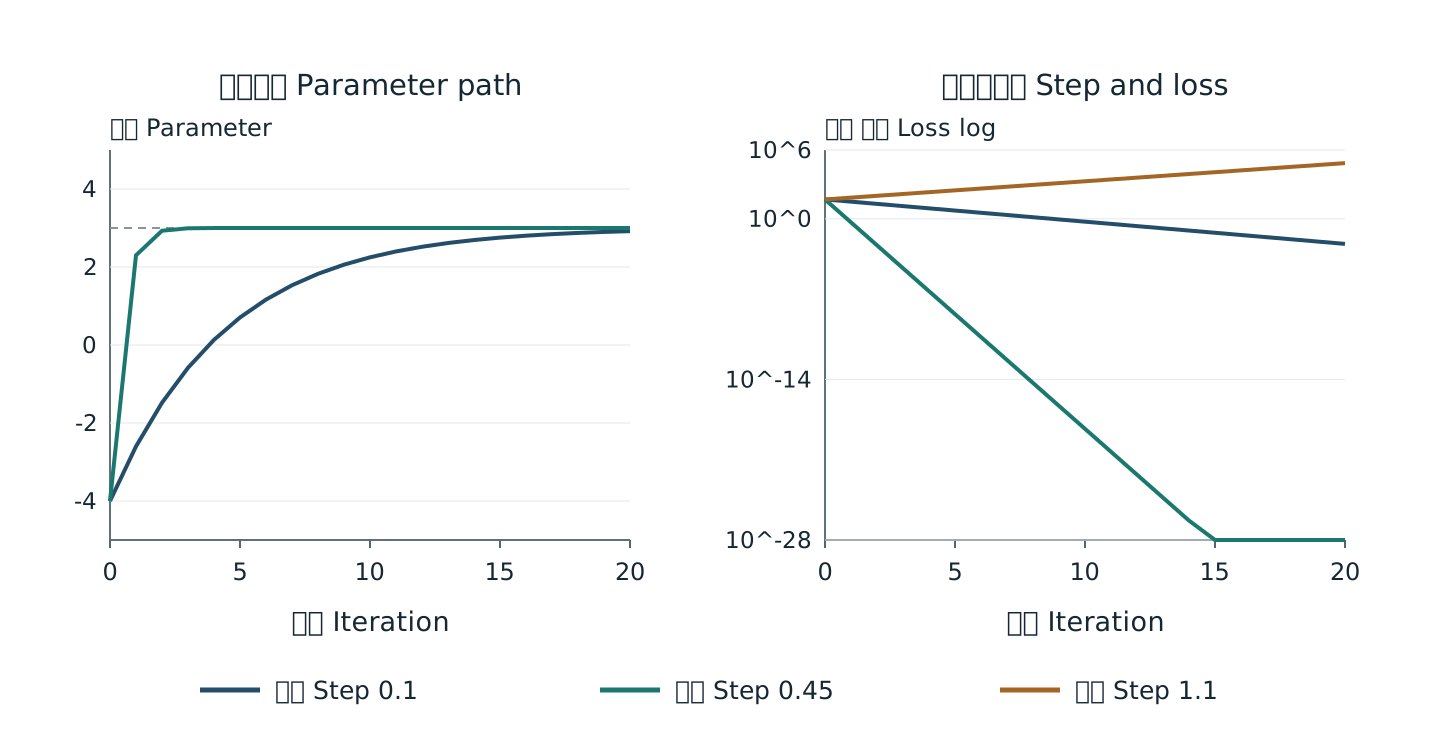
Computed teaching example not a complete model of training The logarithmic loss display uses a floor at 10⁻²⁸ for zero; this does not imply a nonzero residual.
Figures retain bilingual labels; the surrounding text explains them. Open for a larger view.| Dimension | Check | Evidence |
|---|---|---|
| Objective | What understanding does action serve | Predictions and explanations |
| Rule | Does change follow computation | Rule code and independent calculation |
| Range | Are extremes valid | Bounds and error messages |
| State | Can states be saved reset compared | Exported parameters and results |
| Uncertainty | Which factors are omitted | Assumptions and limits |
| Access | Keyboard text and static alternatives | Independent user task |