18.1
From perception to generation and action
Multimodal research increasingly treats vision as part of a process rather than only an input. Some systems convert images into language before continuing. Tool-augmented methods can mark, crop, calculate, or draw. Unified approaches explore interleaved verbal and visual generation. These routes make different trade-offs in information preservation, interpretability, cost, and control; one multimodal label is insufficient.
The 2025 Latent Sketchpad preprint explores generated visual latent representations that can be decoded into sketches.[42] A 2026 world-model study reports benefits of interleaved visual and verbal generation for tasks suited to visual modeling, without a clear advantage elsewhere.[41] These findings reinforce task matching. They concern specific technical settings, not educational effectiveness or proof of identical human and machine cognition.
Application review can ask whether the system uses additional visual information, whether intermediate artifacts preserve constraints, and whether the visual step improves accuracy, cost, or human understanding. A picture attached to prose may be presentation rather than reasoning. A picture used in a subsequent operation still requires checking. New methods increase the complexity of validation rather than remove it.
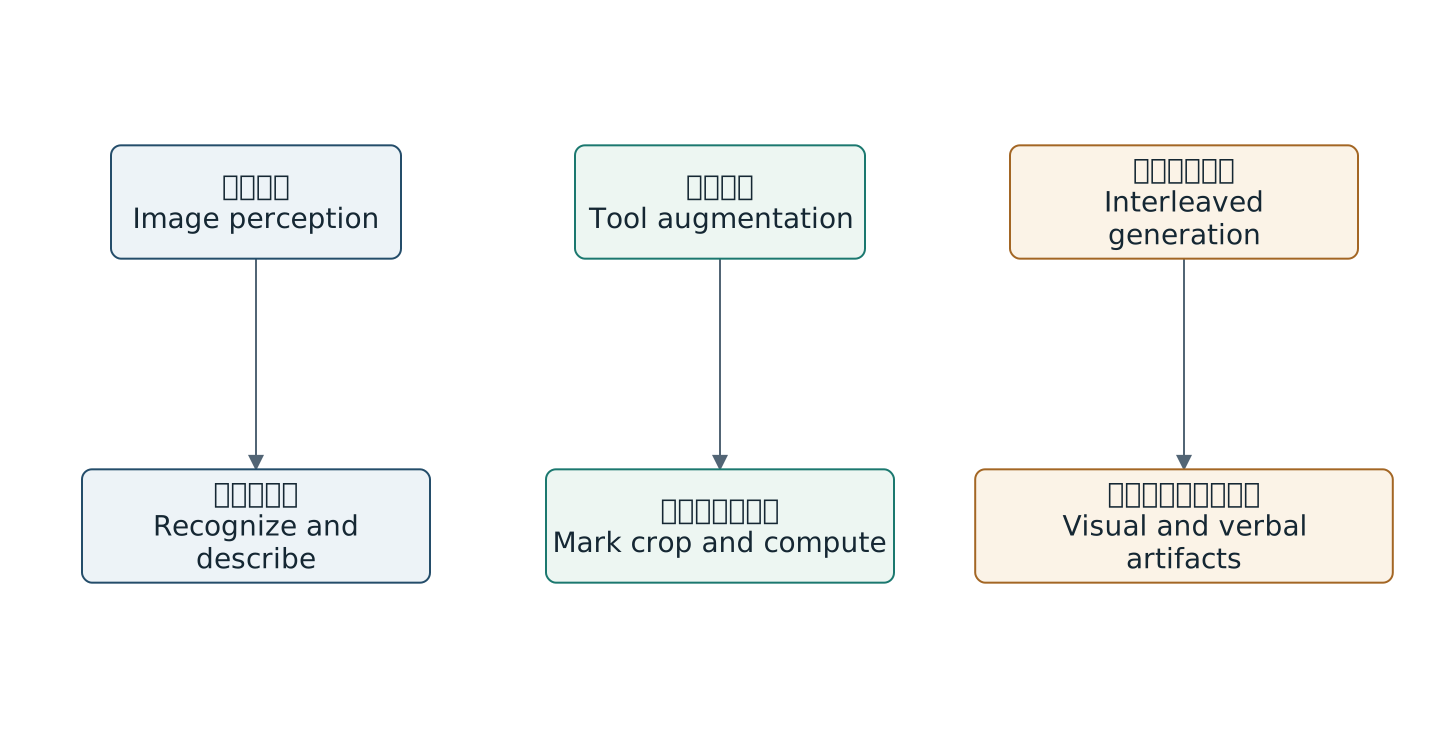
Approach comparison not a capability ranking
Figures retain bilingual labels; the surrounding text explains them. Open for a larger view.18.2
Terms that need consistent use
Visual thinking concerns cognitive activity using visual and spatial representations. Visual literacy concerns reading, evaluating, and making visual information. A representation is a graphical, spatial, or symbolic form with an informational role. Visualization maps data or structure into visual form. Diagrammatic reasoning uses graphical relationships for inference. Visual analytics combines analysis with interactive visual methods. Accessible language is useful, but the terms should not become interchangeable.
Object and spatial imagery are dimensions, not simple equivalents of artistic and logical talent. Concept maps emphasize meaningful conceptual relations. Mind maps commonly organize associations hierarchically or radially. Processes emphasize sequence and conditions. Causal diagrams express hypothesized influence. Knowledge graphs additionally concern typed, queryable data. An author should state what an edge means even when forms overlap.
Models, tools, workflows, and agents also occupy different levels. Retrieval is not verification, generation is not execution, and successful execution is not correctness. A prompt can guide behavior without creating deterministic competence. Expert roles allocate duties without guaranteeing professional reliability. A clear glossary supports transfer across platforms.
| Chinese | English | Boundary |
|---|---|---|
| 视觉思维 | Visual thinking | Cognitive practice rather than decoration |
| 视觉素养 | Visual literacy | Interpret evaluate and create |
| 对象想象 | Object imagery | Object-detail dimension not a fixed type |
| 空间想象 | Spatial imagery | Spatial relations not automatically causation |
| 图解推理 | Diagrammatic reasoning | Inference through graphical relations |
| 多重外部表征 | Multiple external representations | Forms require correspondence and integration |
| 可视分析 | Visual analytics | Interactive visual analysis |
| 检索增强生成 | Retrieval augmented generation | Retrieved context still needs verification |
| 认识性行动 | Epistemic action | Action supports discovery and understanding |
| 可追溯性 | Traceability | Claims link to sources and transformations |
18.3
Five research priorities
Five priorities deserve study: whether reduced production effort preserves selection and integration; when visual feedback outperforms verbal feedback; whether AI-supported structure transfers to independent work; how uncertainty can be interpreted appropriately; and when bilingual graphics support or burden understanding. These questions require defined tasks rather than general attitude measures.
Short- and long-term effects should be separated. Novelty, interface familiarity, and instructor support affect initial use, while habits and skills may change later. Repeated tasks and delayed measures can examine these developments. Instructors without large experimental resources can conduct smaller continuing improvements with stable measures and explicit limitations.
Failures also deserve study: graphics that inflate confidence, intermediate representations that resist maintenance, tasks that do not justify AI, and interfaces that exclude users. Well-documented failures contribute knowledge. Better generation needs to be accompanied by better comparison, measurement, and reporting.
18.4
An integrated judgment on theory and practice
Visual thinking matters because easier information production increases the need for structural and evidential judgment. Graphics can reveal relationships or create a misleading sense of completeness. AI can expand representations or reproduce errors. The worthwhile objective is an environment with sources, manipulation, feedback, and independent testing, where each representation serves a task and each automated action has a responsibility.
For an introductory AI course, course maps, industry problems, tool use, and assessment should be designed together. Instructors explain, learners construct, AI assists transformation and comparison, computational tools verify quantities, and new tasks test transfer. This is a direction for progressive implementation and revision. Its value depends on learners becoming better at understanding problems, explaining evidence, and acting responsibly.