4.1
The strength of conclusions supported by research
Evidence on visual learning should be read in relation to the task and comparison condition. Cromley and colleagues synthesized fifty-three studies involving 8,111 participants and reported an overall standardized effect of g = 0.69. Estimates for factual, inferential, and transfer outcomes were 0.85, 0.44, and 0.22 respectively.[12] These values summarize differences among the included comparisons. They do not mean a sixty-nine percent improvement, and they are not estimates of the benefit of having AI draw on a student's behalf. The differences among outcomes also show why remembering material and applying a principle in a new setting require separate assessment.
The report consequently recommends that course projects include a changed-condition problem. After studying a hotel retrieval workflow, students might encounter conflicting refund deadlines and have to revise the evidence source, date checks, and escalation route. Copying the original diagram demonstrates reproduction. Explaining why the changed conditions require a revision provides stronger evidence of transfer. Assessment should therefore collect an initial representation, a revision, and a reasoned explanation rather than only a final image.
Comparison conditions also constrain interpretation. An advantage over reading alone does not establish superiority over well-designed multimedia instruction, retrieval practice, or feedback-supported explanation. Unequal learning time may contribute to differences. Teaching decisions must consider learning, time, and implementation cost together. An activity can be beneficial yet still be unsuitable if it consumes an entire lesson without advancing its central objective. This trade-off should remain visible when research is translated into practice.
4.2
Scaffolding for integration
Leutner and Biele's 2025 meta-analysis included fourteen studies, sixteen independent comparisons, and 1,213 participants. Drawing support did not automatically improve outcomes overall. Support expected to facilitate integration was associated with better comprehension, with an estimated g of 0.35 in the relevant subgroup.[13] This challenges the assumption that providing any template is sufficient. A scaffold matters not only because it reduces drawing labor, but because it helps learners connect visual material, verbal material, and prior knowledge. The estimate does not specify a fixed benefit for AI scaffolding in general.
In an introductory AI course, a partially completed diagram should therefore contain meaningful relational gaps, rather than merely empty boxes. Students could decide why failed retrieval should lead to a clarifying question, why document versions need checking before generation, or whether escalation should preserve the original evidence. AI can generate gaps at different levels of difficulty, but the instructor must verify their connection to the learning objective. A gap that tests only the name of an interface button principally assesses interface recall.
Feedback should likewise address relationships and reasoning. Instead of saying that a diagram lacks clarity, identify the missing identity check and policy evidence between a customer request and a refund action. Instead of rewarding the number of nodes, ask what would happen if one node were removed. A model solution can appear after an initial attempt, followed by comparison, revision, and explanation. This retains generative activity while reducing the risk that unsupported errors are repeatedly reinforced.
4.3
Conditions for multiple representations and animation
Multiple representations may complement one another, but they also require translation work. The DeFT framework asks designers to consider design, representational functions, and the tasks learners must perform.[9] Rau describes the difficulty of learning unfamiliar content through representations that are themselves unfamiliar.[10] Placing an equation, network, cartoon, and dashboard on one screen is consequently not necessarily better than a single clear relational diagram. The important question is whether students can explain which aspects of a shared object each form expresses.
A 2024 review of more than two external representations covered forty-six studies and used 132 effect sizes in its meta-analysis. The reported performance estimate was small, g = 0.118, and benefits depended on appropriate support.[14] This supports deliberate addition rather than maximizing the number of forms. A table might first define variables, a chart show their relationship, and a linking task require students to locate the corresponding record. Designing the connection between forms deserves more attention than merely displaying them together.
Animation also requires restraint. Tversky and colleagues' analysis emphasizes conditions of expression and comprehension, rather than assuming that dynamic content necessarily benefits from dynamic display.[16] Learners can be given pause, replay, and step controls, with key static frames retained for comparison. Sequential highlighting may clarify an agent loop, but if it moves faster than learners can understand, a controlled sequence is preferable. Understanding and transfer should determine the value of animation, rather than visual activity alone.
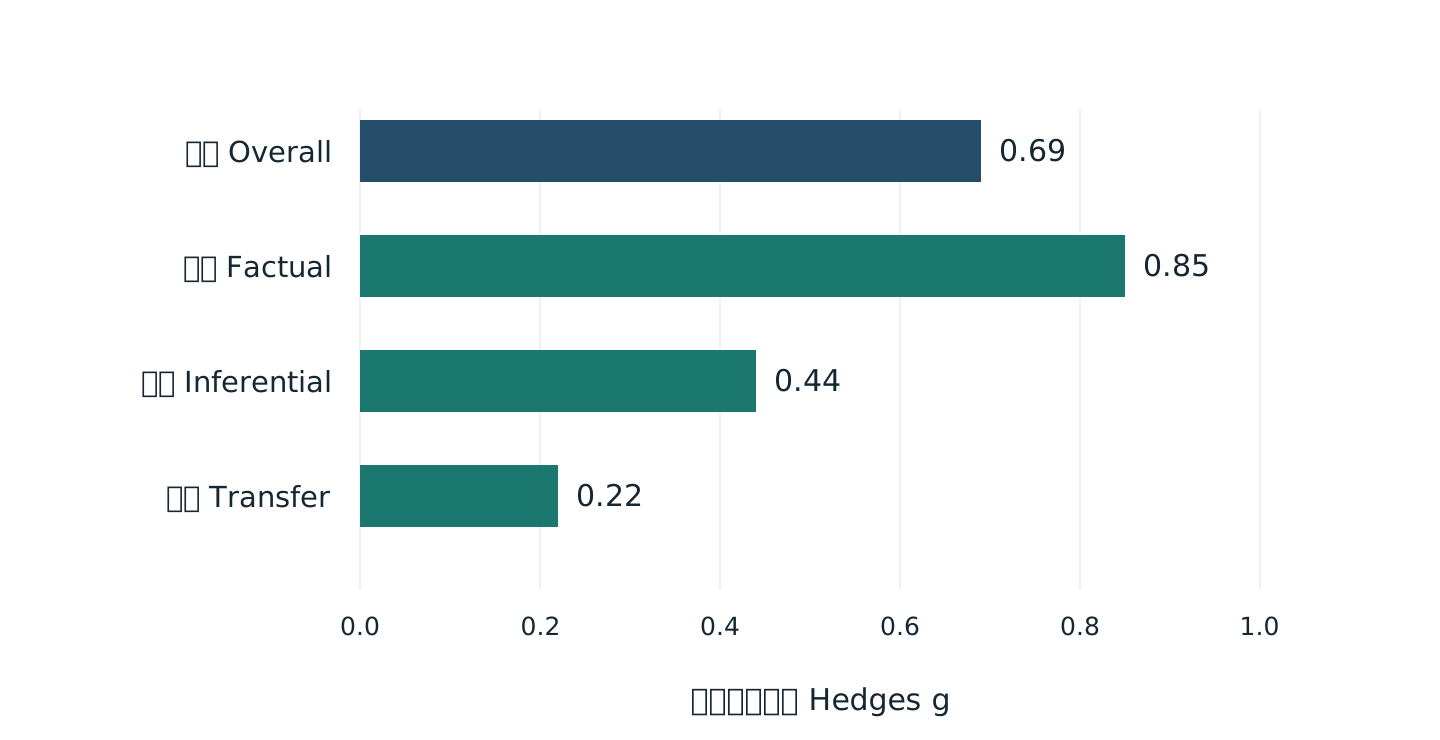
Estimates are not percentage gains or independent method rankings
Figures retain bilingual labels; the surrounding text explains them. Open for a larger view.4.4
Cautious inference about AI assisted drawing
Traditional drawing-to-learn research usually requires the learner to select, organize, and externalize content. AI can perform much of that work directly. Evidence for learner-generated drawing therefore cannot simply be transferred to AI-generated drawing. The issue is to identify where human cognitive participation remains. A student who submits a completed graphic after entering a topic may have done little structural work. A student who compares candidates, identifies errors, rebuilds relationships, and explains revisions may retain substantial reasoning while reducing production effort. That possibility requires direct testing.
Recent review work continues to emphasize variation in drawing-task designs and boundary conditions.[39] The report consequently recommends treating AI-generated diagrams, human revision of AI diagrams, human-first drawing followed by AI feedback, and study of standard diagrams as distinct conditions. Interventions should report prior knowledge, production time, diagram accuracy, feedback, delayed testing, and transfer. Enjoyment alone cannot identify what has improved.
| Study | Reported evidence | Does not establish |
|---|---|---|
| Cromley等 2020 [12] | 53 studies 8111 participants overall g 0.69 | Not a 69 percent gain or an AI drawing estimate |
| 同一元分析 [12] | Factual 0.85 inferential 0.44 transfer 0.22 | Outcomes are not an independent ranking |
| Leutner与Biele 2025 [13] | 14 studies integration-support subgroup g 0.35 | Not support for every template |
| Rexigel等 2024 [14] | 46 studies performance estimate g 0.118 | Not an unlimited more-is-better rule |
| Fiorella与Zhang 2018 [11] | Comparators and guidance matter | Not universal superiority over good multimedia |
| Pashler等 2008 [6] | Insufficient support for style matching | Does not deny differences or access needs |