5.1
Representation choice as a modeling decision
The first decision in graphic design is a modeling decision, rather than a color decision. A tree assumes hierarchical organization. A network permits multiple connections. A process diagram emphasizes sequence and conditions. A matrix supports cross-comparison. A coordinate chart requires definable variables. Representing a service system with feedback as a one-way chain hides repeated questions and rework. Placing AI at the center of every radial map may obscure the difference between a business objective and a tool. The chosen form already contains an interpretation.
Before drawing, the author can write a short representation brief: what question is being answered, what the objects are, what a connection means, what is excluded, and what the audience should do next. Explaining responsibility handoffs in complaint handling constrains an output more effectively than requesting a professional-looking hotel diagram. The latter encourages AI to complete a familiar pattern. The former directs attention toward records, responsible roles, and escalation conditions that a human can inspect.
Granularity also needs control. A single data-processing node may suit a course overview but be inadequate for practical instruction. Expanding file loading, date cleaning, and duplicate removal may help implementation while obscuring the business story. An overview and a detailed view can share stable identifiers. Readers can then enter detail without losing its place in the whole. This supports revision more effectively than putting every detail into one enormous diagram.
5.2
Explicit meanings for nodes and arrows
Nodes may represent roles, tools, files, actions, states, or concepts. These categories should not be mixed without explanation. Arrows may express sequence, data transfer, dependency, control, causation, or resemblance. An unsupported arrow from AI to increased revenue expresses an expectation. An arrow from a knowledge base to a language model should identify retrieved passages entering context, rather than imply that the entire database has become part of the model. Naming relationships prevents a diagram from making commitments that its author has not justified.
A limited instructional vocabulary is useful: reads, produces, retrieves, reviews, triggers, depends on, hypothetically influences, and requires human confirmation. Labels and line styles can distinguish these meanings, with color as a supplementary cue. Important edges should specify a rule or source, such as escalation when a refund exceeds an authorized limit. If an author cannot explain an edge, it should be removed or marked for confirmation rather than made plausible through layout.
Boundaries also carry meaning. A surrounding frame can denote system scope, organizational responsibility, or data permission. The relationship between an agent's planning component and an external payment service should make permission and confirmation visible. A course map should distinguish tools from capabilities: operating a charting application does not establish competence in choosing an encoding. Learners need to read these conventions and detect semantic conflicts in other people's diagrams.
5.3
Data definitions and quantitative scales
Trustworthy quantitative graphics connect data definitions with visual encodings. Cleveland and McGill's research on graphical perception shows why different encodings place different demands on accurate comparison.[18] If readers need to compare channel revenues, bars on a shared baseline are often easier to inspect than differently sized decorative icons. If they need distributions and outliers, a single mean may be inadequate. The intended comparison should guide the choice.
Each data chart should state its variables, units, time span, statistical definition, missing-data treatment, and source. Percentages need denominators, cumulative values need starting points, and dual axes need a reason for using separate scales. An AI-generated smooth curve must not fill unobserved periods and then appear as an actual trend. Observed, estimated, and scenario segments should be distinguishable, with uncertainty explained.
For teaching data, transparency matters more than realistic appearance. A synthetic hotel example can use a simple demand function if its title and note state that it is an illustration. Simplification allows learners to see how objectives and assumptions change a decision; it should not simulate the authority of actual hotel observations. Students should be able to recompute several points, change a parameter, and explain the resulting curve. This is more useful than a polished dashboard that cannot be reproduced.
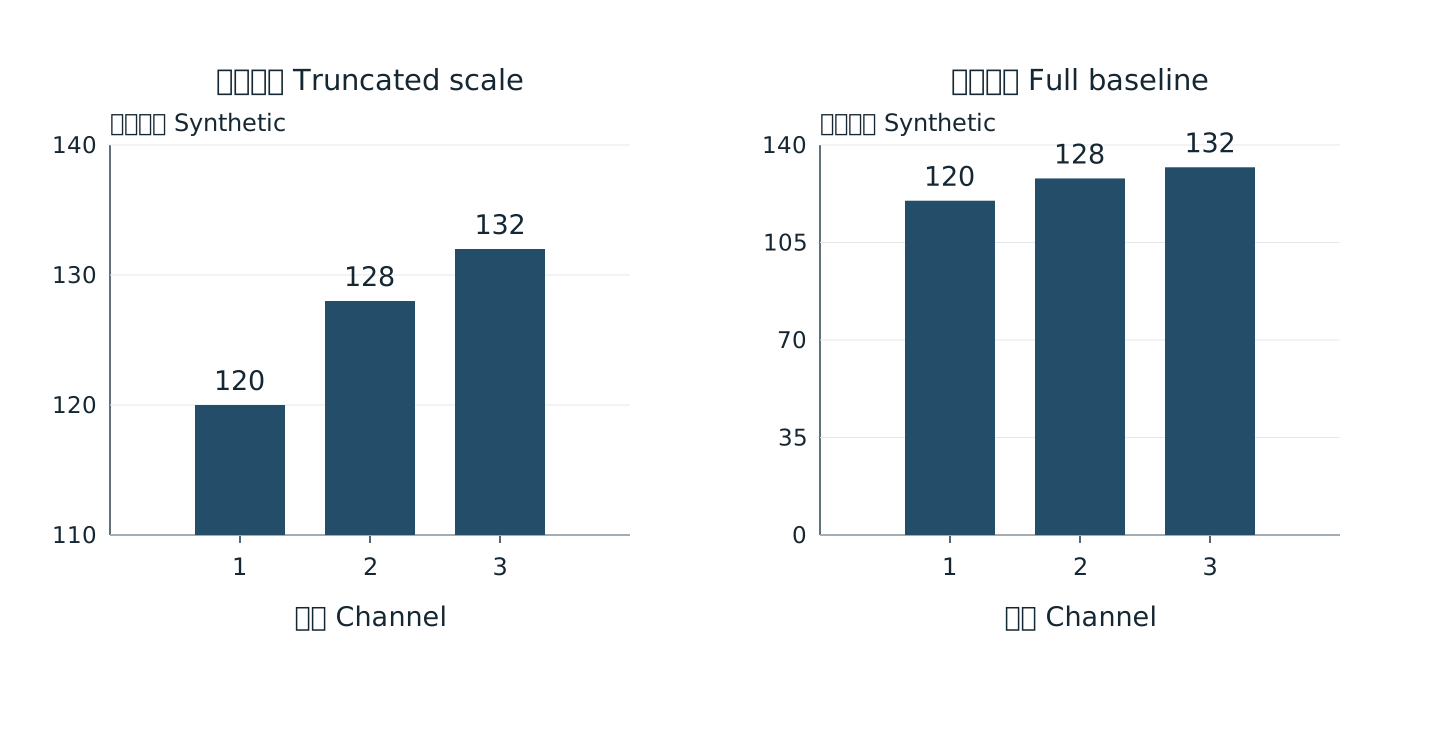
Synthetic demonstration with identical values
Figures retain bilingual labels; the surrounding text explains them. Open for a larger view.5.4
Bilingual alignment and accessibility
This report places Chinese and corresponding English within the same subsection, instead of forcing long passages into narrow parallel columns. Core figure labels use short bilingual phrases, while longer explanations appear in captions and prose. Tables translate the fields needed for comparison. This preserves alignment without overcrowding the graphic. Translation aims to preserve logic, qualifications, and evidential strength, rather than reproduce Chinese word order.
W3C guidance for complex images emphasizes text alternatives that convey important information.[32] A caption should therefore summarize the main route, branches, and exceptions rather than merely identify a process illustration. Color should be supplemented by labels or line styles, and necessary contrast should be checked.[33] Interactive work also needs attention to keyboard access, initial states, reset controls, and static alternatives. The educational value of visual thinking should remain accessible to people who cannot conveniently see or manipulate a graphic.
| Item | Acceptance question | Repair |
|---|---|---|
| Relation grammar | What does each edge mean | Label or remove unsupported edges |
| Definitions | Are units and denominators visible | Add dictionary and notes |
| Hierarchy | Can the main route be located | Use layers and stable identifiers |
| Color encoding | Is meaning available without color | Add line styles and direct labels |
| Complex-image alternative | Does text convey the important content | Describe main route branches and limits |
| Interactive access | Are pause reset and keyboard available | Provide static views and alternative input |